homefield.
King County, WA

What the satellites saw

Every number in homefield comes from NASA-backed satellite observations, processed ahead of time so a report loads in about a second.

  • 1,158

    radar flood maps

  • 45

    clear Landsat summers

  • 9

    years of ground motion

  • 30 m

    detail

Flood

Sentinel-1 radar sees through storm clouds. NASA JPL's OPERA project turns each pass into a water map; we processed all 1,158 passes over King County since September 2024 and recorded, for every 30 m square, how often it was underwater and when.

Source: NASA JPL OPERA DSWx-S1
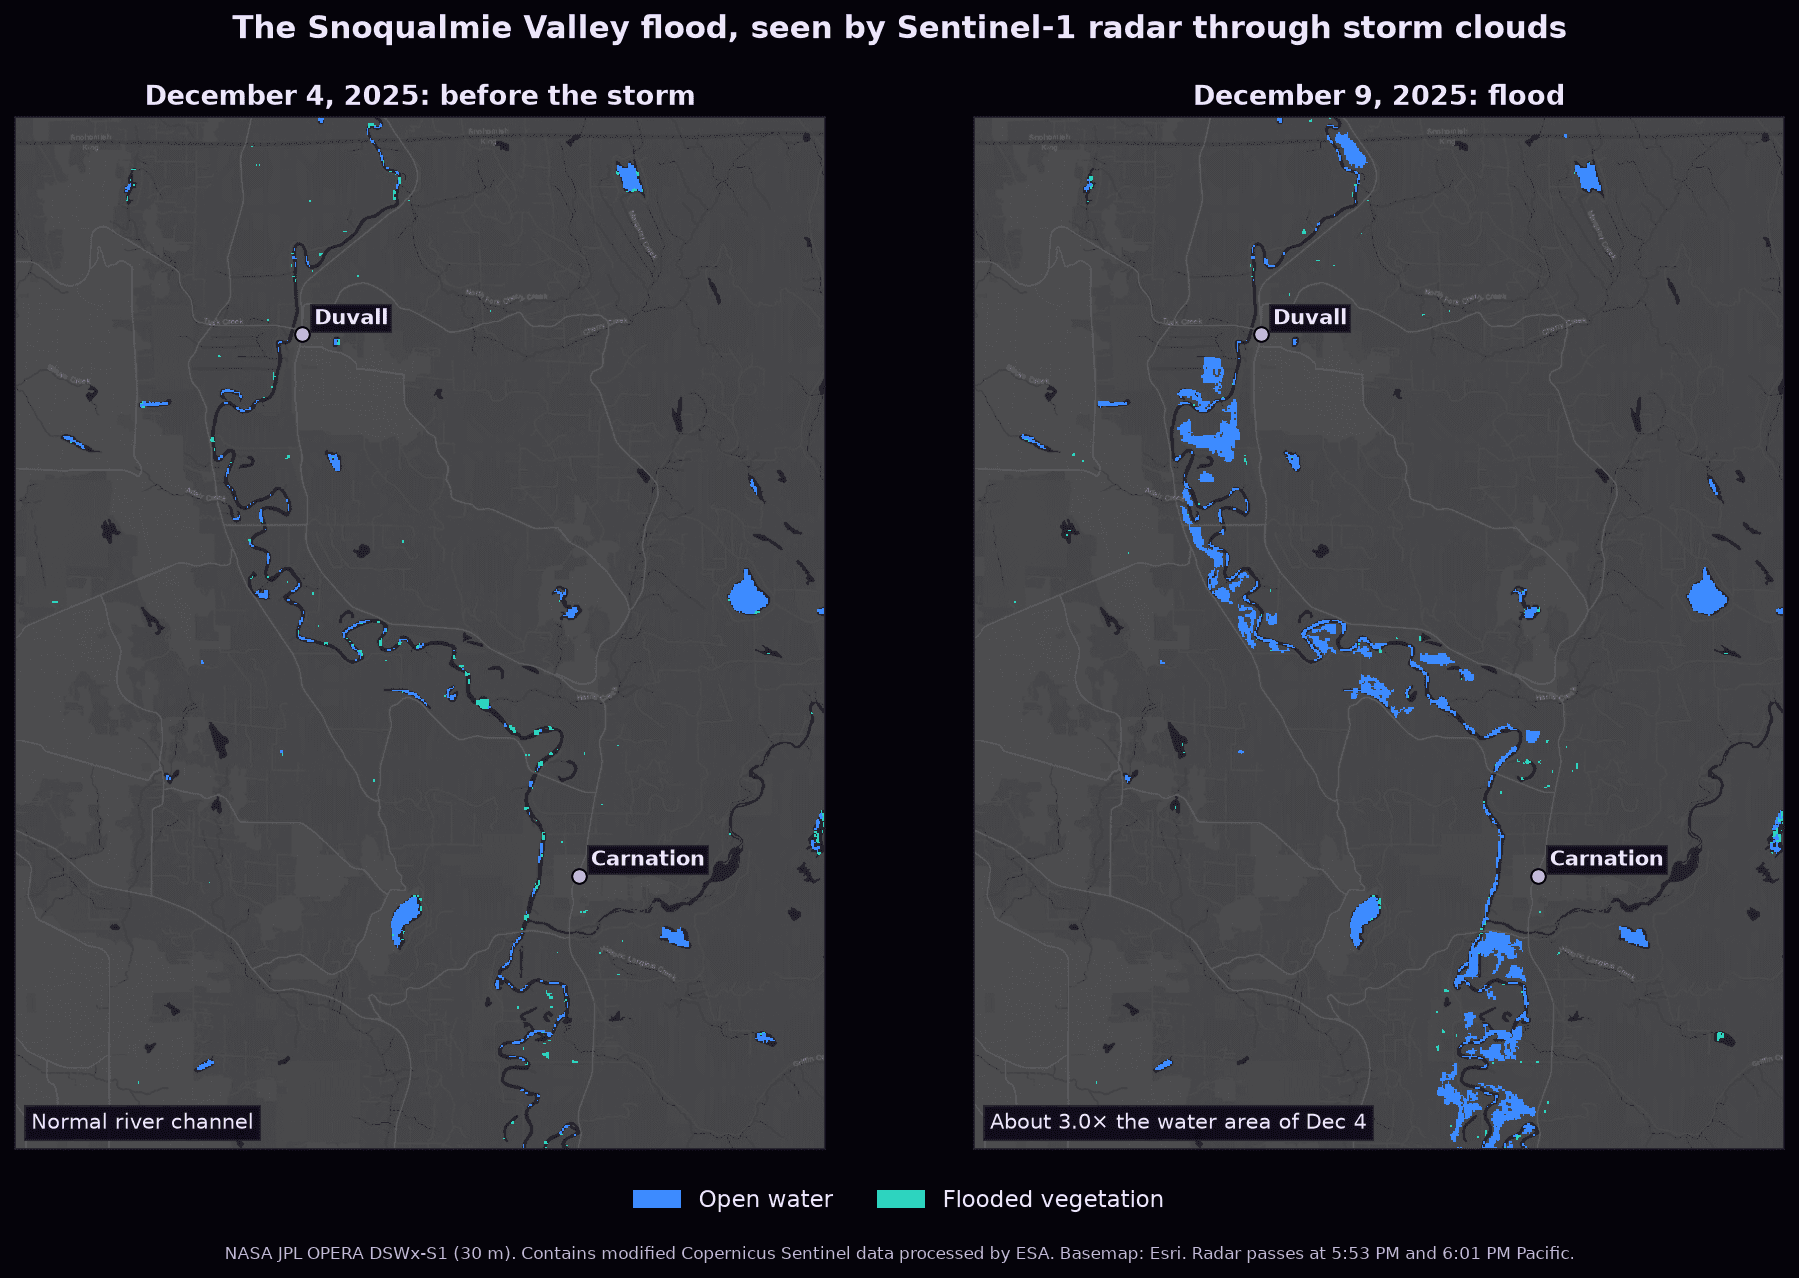
Side-by-side radar water maps of the Snoqualmie Valley before and during the December 2025 flood, showing the river spreading across farmland near Duvall and Carnation

Heat

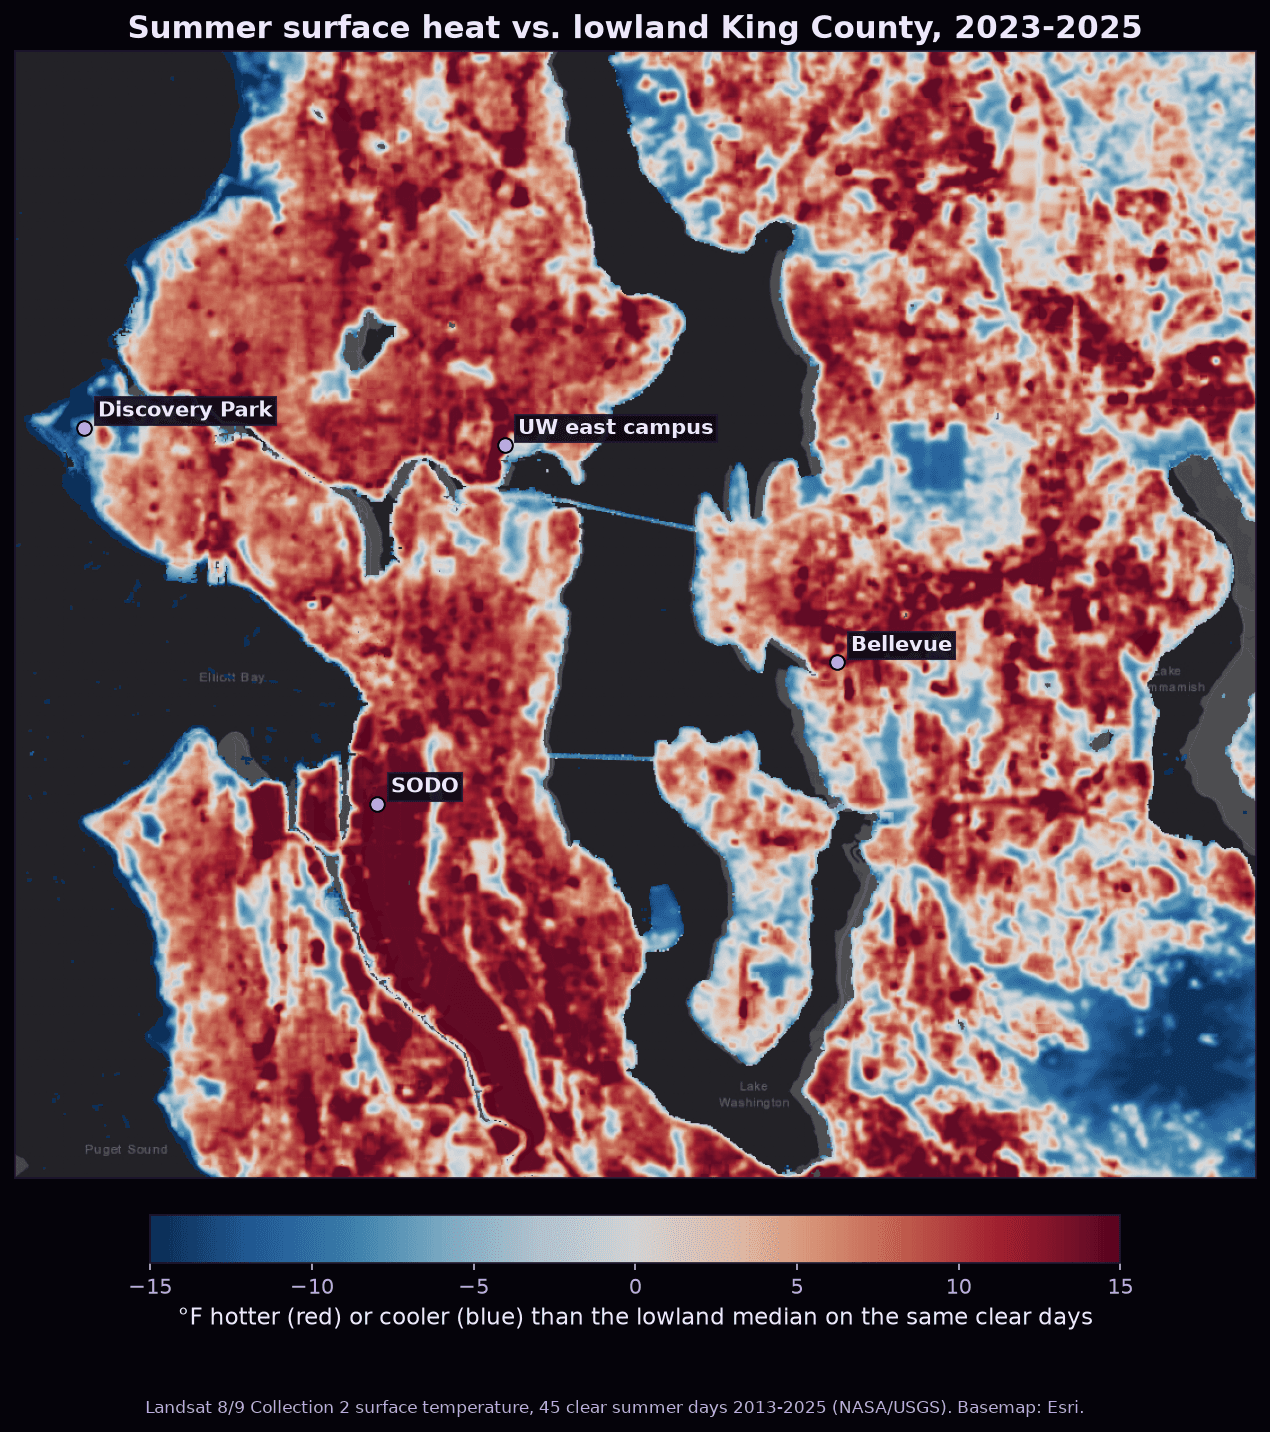
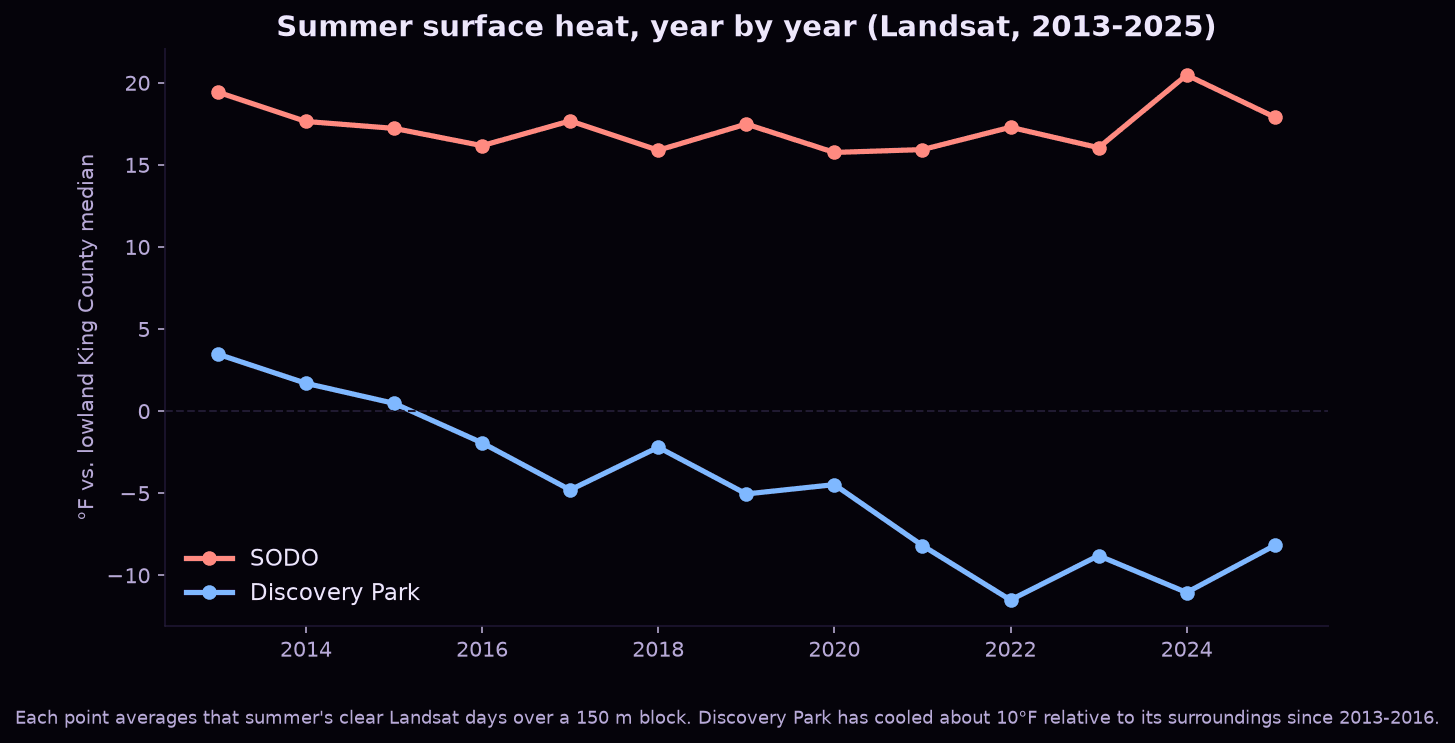
45 clear summer days of Landsat thermal data since 2013. Each day, every spot is compared to the rest of lowland King County, so the weather cancels out and 13 summers become comparable.

Source: Landsat 8/9 Collection 2 surface temperature (NASA/USGS)

Map of Seattle and the Eastside colored by summer surface heat relative to lowland King County, with SODO and Bellevue running hot and Discovery Park and parks running coolLine chart of summer surface heat from 2013 to 2025, with SODO staying about 15 to 20 degrees Fahrenheit hotter than lowland King County while Discovery Park cools by about 10 degrees

Ground motion

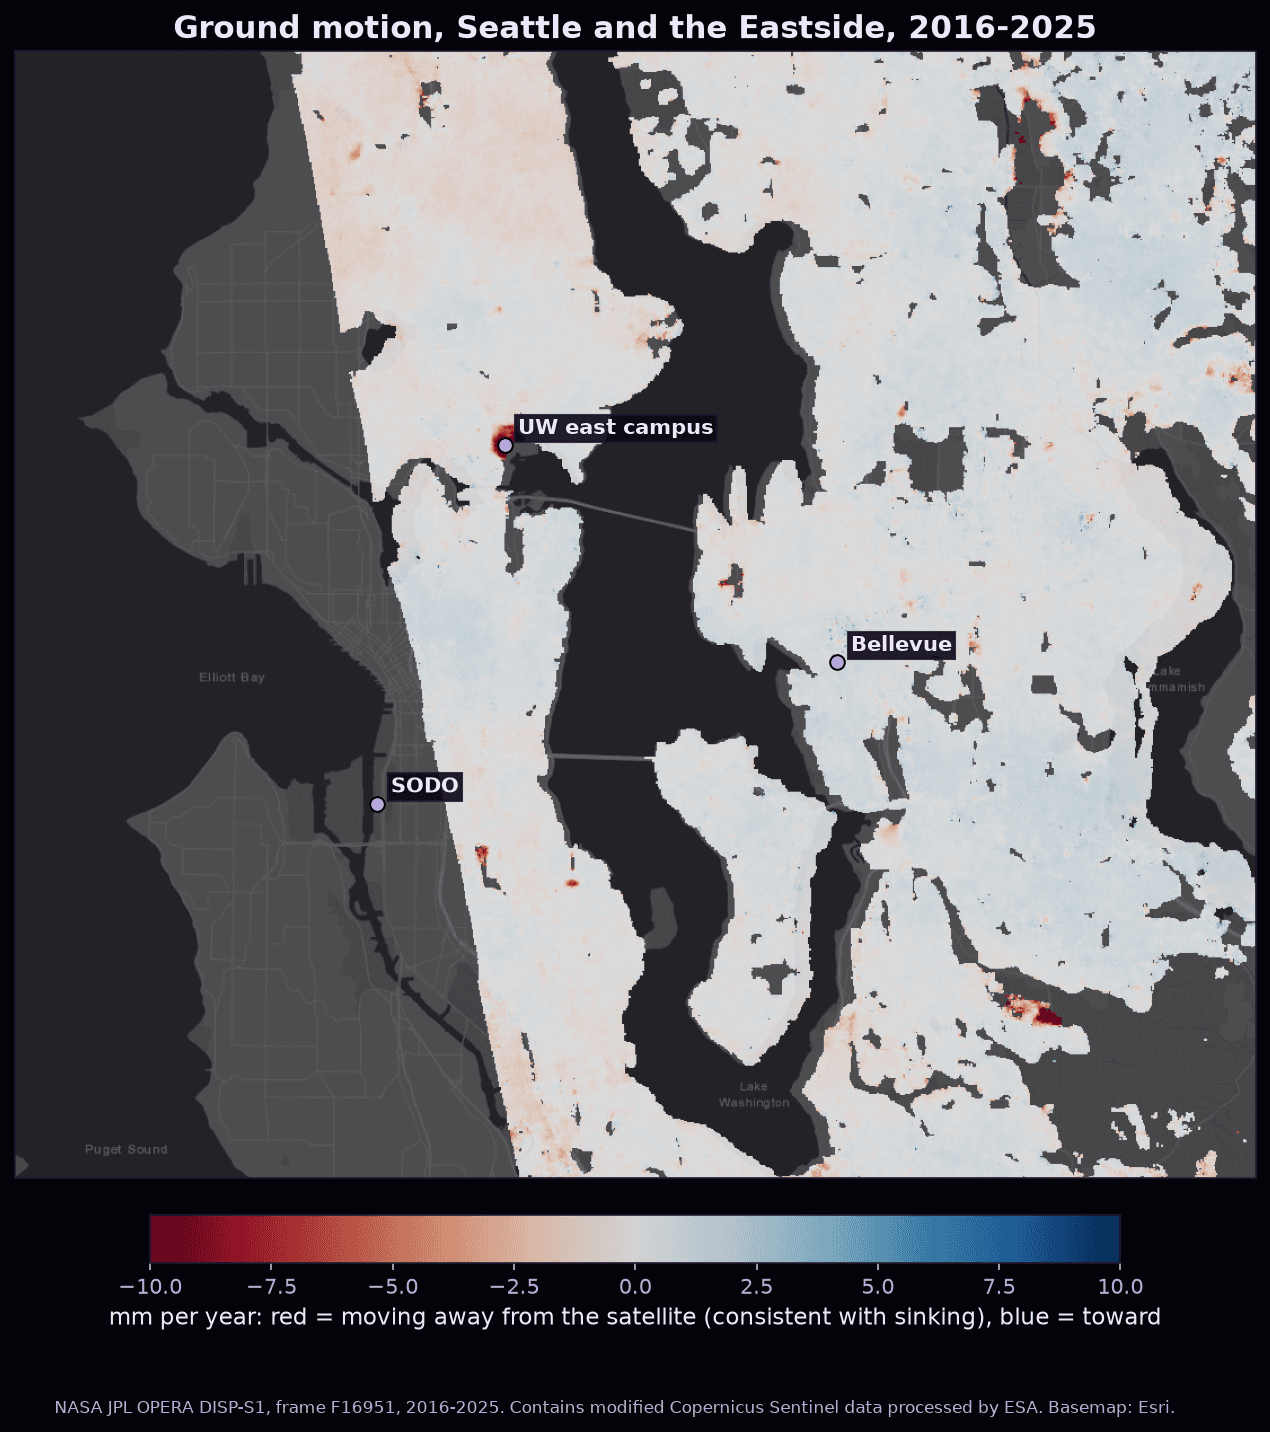
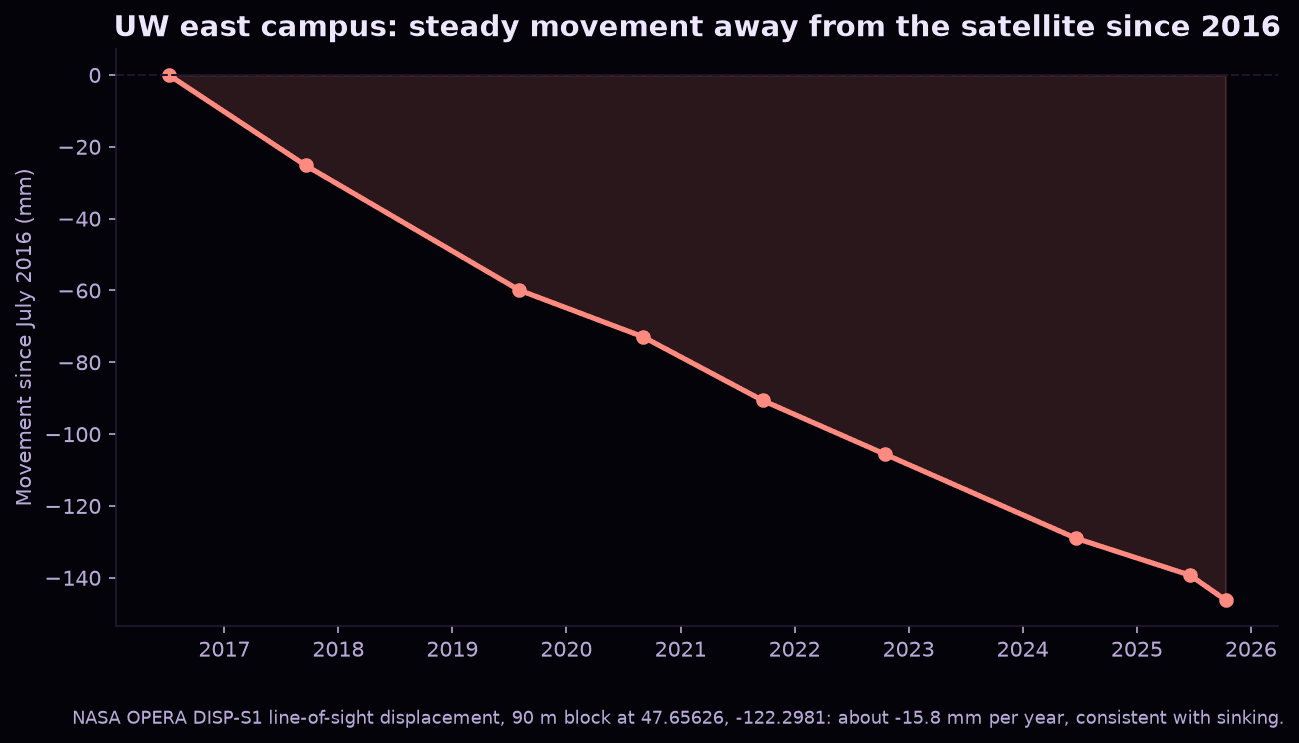
Radar interferometry measures millimeters of movement. We chained 8 of NASA's 119 files, about 51 GB, into one record from 2016 to 2025. UW's east campus has moved about 14 cm, consistent with sinking.

Source: NASA JPL OPERA DISP-S1

Map of ground velocity across Seattle and the Eastside from 2016 to 2025, mostly stable with a red hotspot of movement away from the satellite at the UW east campusChart of ground movement at the UW east campus falling steadily from 0 in July 2016 to about minus 145 millimeters in 2025

Contains modified Copernicus Sentinel data processed by ESA, analyzed by NASA JPL/Caltech's OPERA project. Landsat courtesy of USGS and NASA.